
![]()
Today at Deals 3D The Dealmap VP of marketing Dan Visnick shed light on his network data, as a directional representation of the trends we’re seeing in local deals.
The Dealmap, for those unfamiliar, aggregates 350 deal sources for its own branded apps and its API. The latter is used widely by start-ups looking to build a quick volume of deals content. It currently has $10 million in total savings value across its network, according to Visnick.
It recently launched the DealExchange, which provisions and optimizes deal distribution between deal sources (Groupon, Gilt, etc.) and distribution (search, social, etc.). In this growing market, a classic 80/20 rule exists where inventory market share is dominated by the few top sites.
Forty percent of the inventory in the U.S., for example, is ruled by the top two sources (presumably Groupon and LivingSocial). The average inventory from these leaders per market per day is 6.25, while the median across the board is 1.29.
Only 4 percent of deal providers have a national footprint while 9 percent are in 10-24 markets. The biggest share goes to deal providers in 2-9 markets at 69 percent. Meanwhile 19 percent of providers are in a single market. These numbers indicate an opportunity for syndication, Visnick asserted.
In terms of mobile activity, retail surprisingly skewed higher as a share of overall deal volume, when compared with its share online. Mobile is also growing as a share of deal products being released — currently at 32 percent compared with Web (61 percent), email (2 percent) and “other” (5 percent).
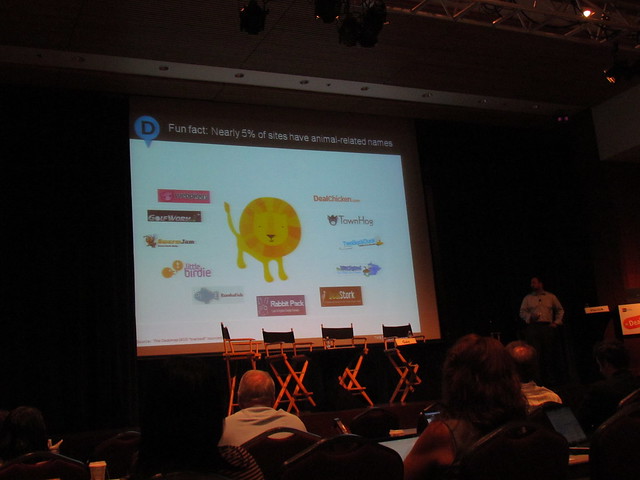
But most intriguing of all, according to Visnick: 5 percent of deals sites have animals in their names — i.e., TownHog, CouponBee and DealRhino (I might have made up at least one of those).
This Post Has 0 Comments