
According to BIA/Kelsey’s Local Commerce Monitor, Wave 17™, 72% of the SMBs surveyed use social media to promote their business. Of the different social media used for advertising and promotion that BIA/Kelsey tracks in the LCM survey, Facebook Page ranked the highest with 52.1% of the SMBs surveyed reported using a Facebook Page for advertising and promotion. LinkedIn and video on websites were a distant second and third, with 28.0% and 26.1%, respectively. Twitter was close behind in fourth place, with 24.3%.
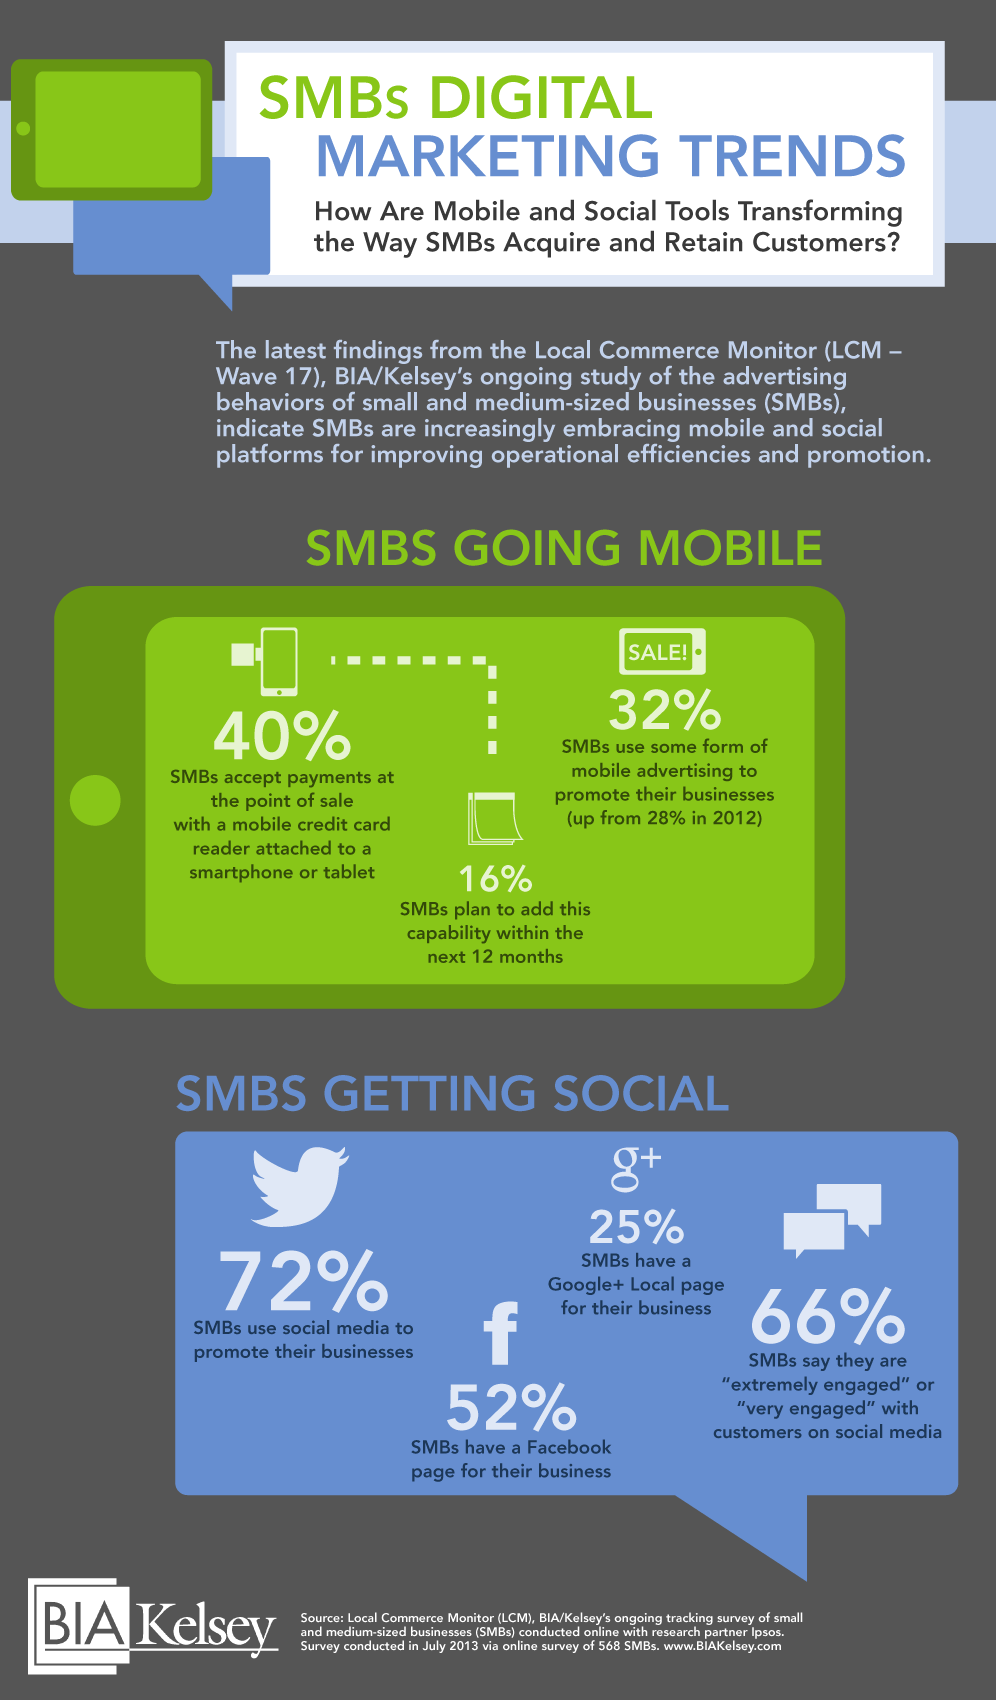
Social media can provide SMBs with an immediate and interactive connection with their customers. So how do SMBs perceive the return on their investment for time spent in advertising or promoting themselves on social media?
In BIA/Kelsey’s annual Local Commerce Monitor™ (LCM) survey on advertising and marketing of small and medium businesses (SMBs), we asked several questions on the satisfaction of the various advertising and marketing choices made. It should be noted that only SMBs who reported using a particular media were asked for their ROI assessment of that media.
While only 15.5% of SMBs surveyed reported using Facebook ads to advertise and promote their business, they gave it the highest combined ROI of Excellent (10-19x spend) and Extraordinary (more than 20x spend) of the social media in the survey, at 45.4%. Blogs, which 19.0% of SMBs surveyed reported using for advertising and promotion, had the second highest combined ROI at 37.0%. Video on YouTube and Facebook Pages were a close third and fourth, with 34.6% and 34.1%, respectively. LinkedIn and Twitter, which were second and fourth among SMB users, were ranked lowest two of the social media, with combined perceived ROI of 31.1% and 23.9%, respectively.
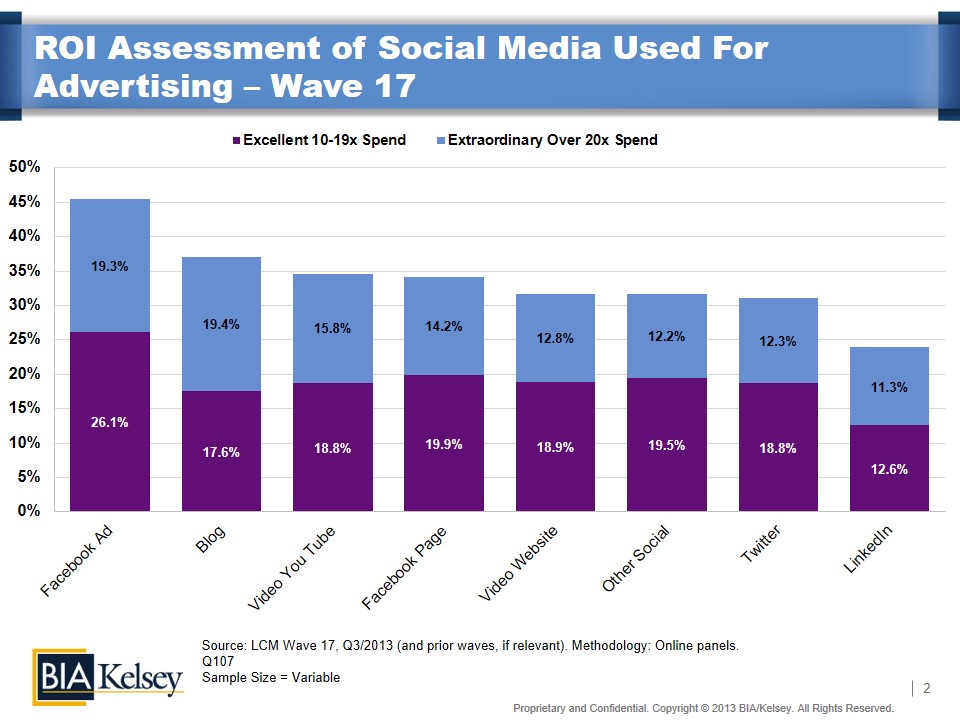
But where do these social media rank in usage by SMB of the 44 of the media channels in the survey? Facebook ads ranked No. 5 in media used for advertising and promotion overall. Blogs came in at No. 16. Video on Youtube and Facebook Pages were ranked Nos. 21 and 22, respectively. Twitter was 31st, with LinkedIn coming in next to last in 43rd place.
LinkedIn and Twitter are still relatively new channels for many SMBs, so there still may be some learning curve there. Especially for Twitter, which has a unique language and set of conventions and hasn’t also been seen as especially business-friendly. One reason Facebook ads perceived ROI is higher is SMBs ability to track their campaign spending and toggle performance, as opposed to “owned media” channels such as Facebook Page, Twitter and LinkedIn, where tracking and measurement can be more nebulous.
In comparison to a year ago, seven of the eight social media showed improvement in perceived ROI from Wave 16 of the LCM survey, 3rd Quarter 2012. Twitter was the fastest growing social media channel year-over-year, at 24.4% for Excellent/Extraordinary perceived ROI. Facebook ads were a close second, with 23.7% year-over-year growth. Facebook pages showed 16.0% year-over-year growth in perceived ROI.
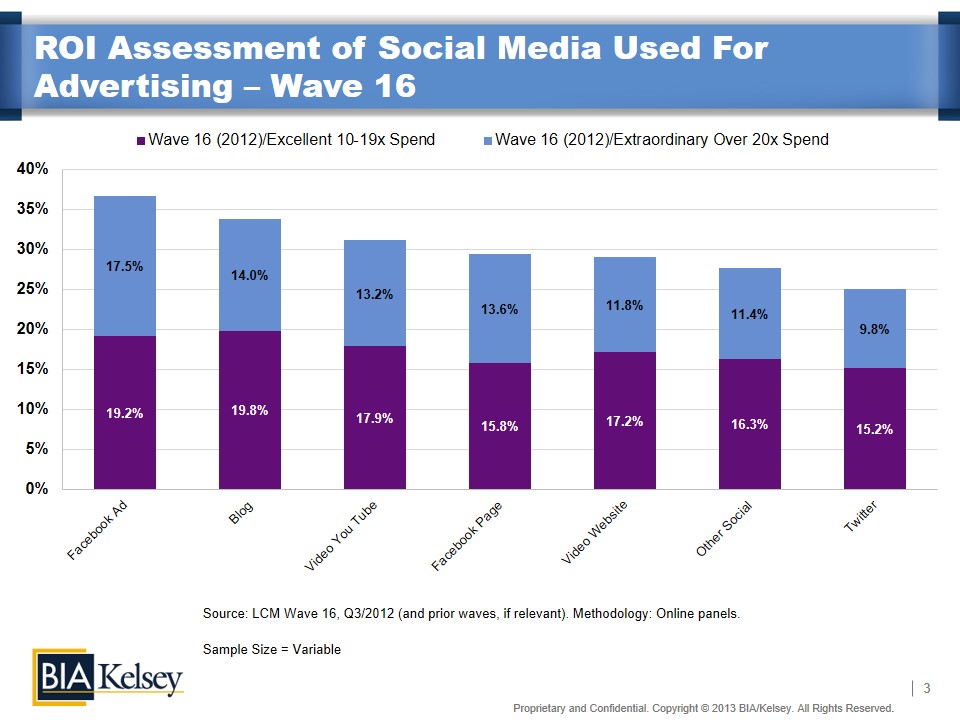
ROI is improving year-over-year for social media, but there’s still ample room to optimize effectiveness. Again, many of these channels are still relatively new (especially when compared to very familiar traditional media), and measurement standards and best practices are still being fashioned.
For more about SMB’s use of Twitter in advertising and promotion, check out this blog post.
Interested in learning more about Local Commerce Monitor Wave 17™ or getting a custom cut for your business? Check out BIA/Kelsey’s LCM page.
We’ll be covering this and other themes in greater depth at our upcoming conference, Leading in Local: Interactive Local Media, December 10-12 in San Francisco. Be there and join the conversation.
This Post Has 2 Comments
Leave a Reply
You must be logged in to post a comment.
From the above infographics, I see that Social ROI for SMBs is the best when used Facebook for promotion still 72% of the people are marketing with Twitter. Do we see any mismatch here?
Hi Ajith. Although we used Twitter’s logo in the infographic, the 72% is actually for all social media surveyed. So Facebook, Twitter, LinkedIn, etc. are included in that 72%.