

The pandemic shook the world and affected many business verticals, disrupted economies and reshaped industries. As governments imposed strict lockdowns, businesses faced a multitude of challenges, with issues like supply chain delays, rising interest rates, employment issues, tech layoffs, economic concerns, and consumer spending. Companies were forced to reevaluate their priorities and make difficult decisions about their advertising strategies and budgets.
Now, with the U.S. Government and the World Health Organization declaring the end of the pandemic, it’s fascinating and important to track the advertising recovery by business verticals. With some Covid-related factors still lingering for some industries, BIA estimates recovery will be stretched out over several years.
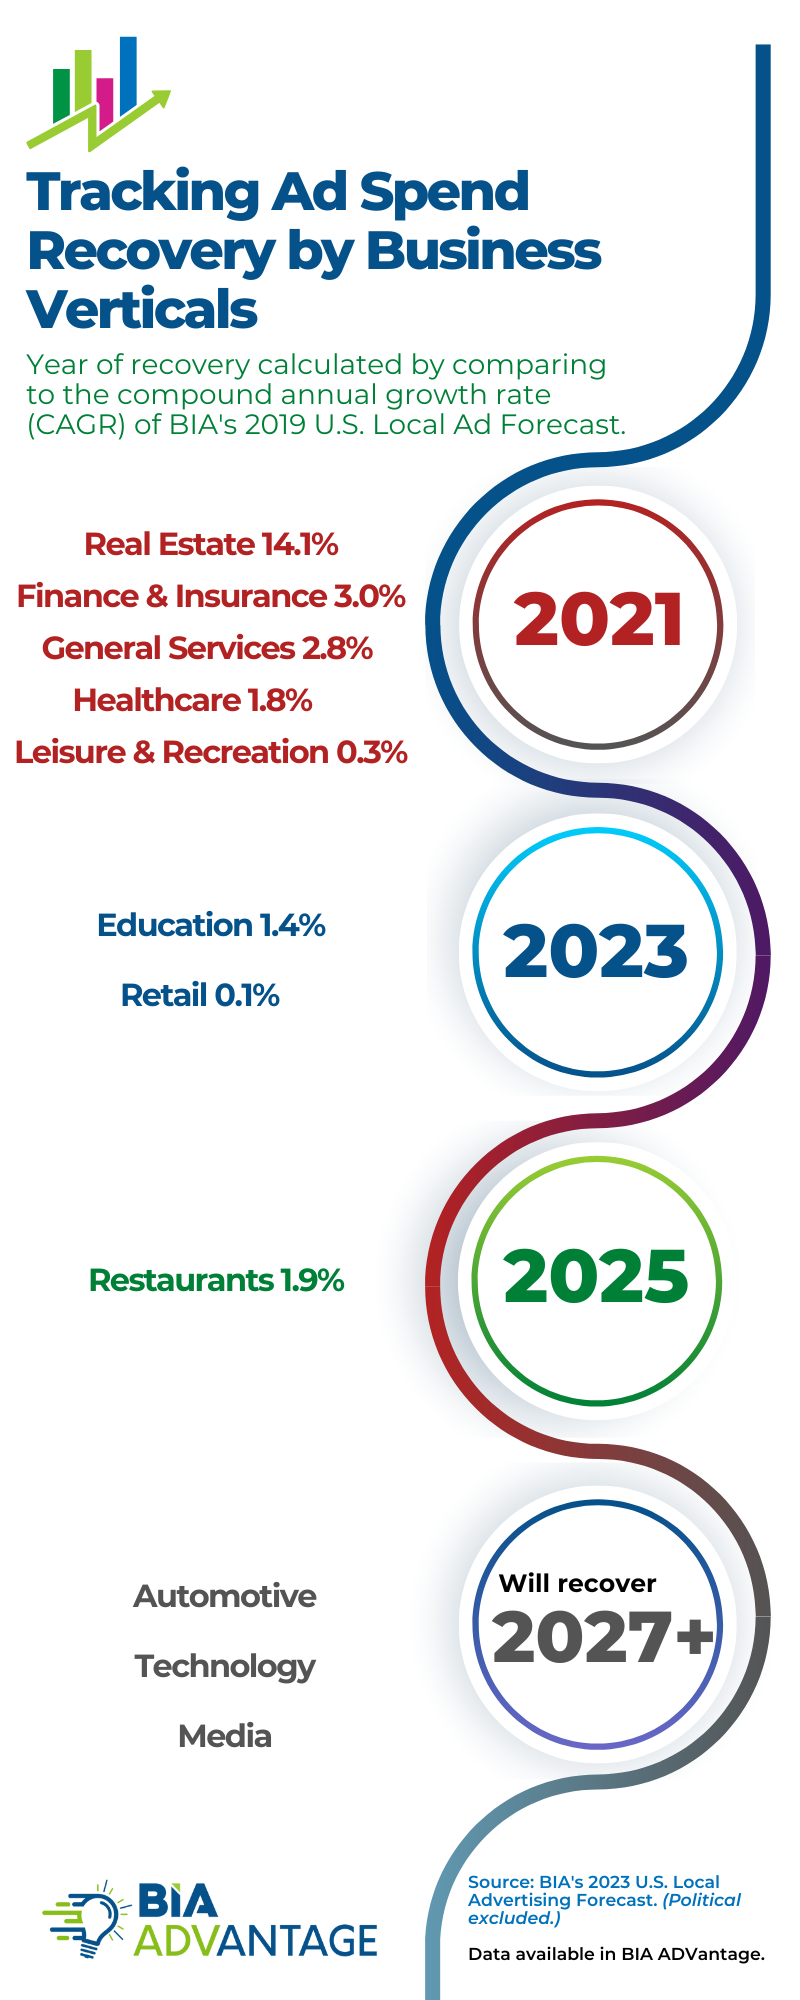
BIA’s local advertising forecast covers 12 super-verticals and 96 sub-verticals. Using our 2019 forecast for comparison, we examined each super-vertical to identify the year it will recover and even start growing. Here’s what we found.
Several key super-verticals recovered in 2021, surpassing their 2019 levels. These included Real Estate, Finance and Insurance, General Services, Healthcare, and Leisure and Recreation.
Following a strong recovery year, 2022 did not result in any verticals recovering in comparison to their 2019 performance.
This year, 2023, looks promising for two important super-verticals: Education and Retail. Both will experience a significant rebound, surpassing their pre-pandemic levels.
Looking forward to 2024, Political will dominate, crowding out other verticals and their recovery to 2019 levels.
In 2025, BIA forecasts show Restaurants surpassing their pre-pandemic levels.
Lastly, 2027 and beyond will witness the gradual recovery of Automotive, Technology, and Media.
Now, we realize economics, continuing supply chain disruptions, and even new technologies will affect our estimates. BIA updates its U.S. Local Advertising Forecast estimates 2-3 times each year and an update will be released mid-June 2023. We will update this analysis when/if it changes.
Our BIA ADVantage clients can get a deeper analysis of the recovery process for each of the 96 sub-verticals in our forecast. The Selling Aids area of BIA ADVantage offers 11 more infographics illustrating the recovery each sub-vertical. Login now to view.
This Post Has 0 Comments